KPI dashboard services · Power BI & Excel
Turn your KPI chaos into decision-ready clarity
We build automated KPI dashboards, sharpen your Power BI and Excel reporting, and translate performance movement into business understanding, so your team acts on insight instead of arguing about metrics.
Hamburg-based · working worldwide, fully online · fast delivery, clear communication.
What we solve
Reporting that creates debate instead of direction
If your dashboards raise more questions than they answer, you are not alone. These are the patterns we untangle every week.
Too many metrics, and no shared view of which ones actually matter.
Unclear KPI logic: the same number means different things to different teams.
Manual reporting that eats hours every week and breaks when someone is away.
Dashboards that show what happened but never explain why or what to do next.
What we do
Analytics services, built around your questions
ServiceKPI Analytics is your one partner to turn KPI ambition into measurable business value.
Automated KPI Dashboards
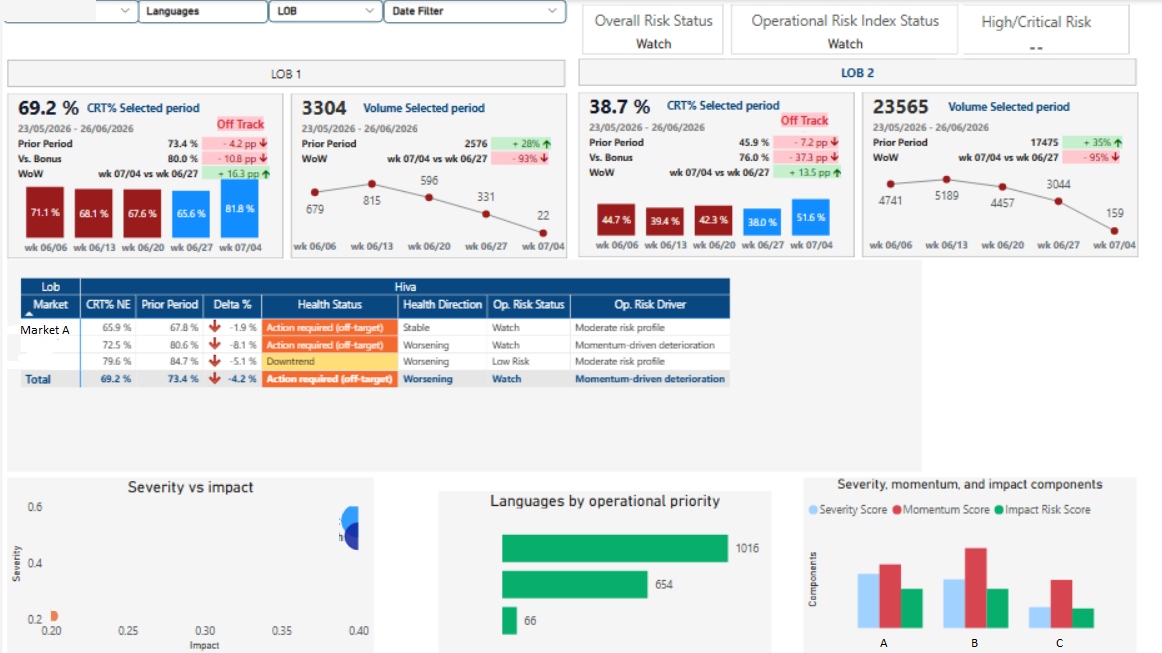
Connect to your existing data ecosystem and eliminate manual reporting with clean, self-refreshing Power BI and Excel dashboards.
Advanced Analytics & Data Insights
A deep analytical layer that isolates drivers, segments performance, and turns data into decision-ready insight.
KPI & Metrics Insights
Fewer, clearer KPIs with driver-based logic your stakeholders trust, no more reporting that sparks debate.
Dashboard Optimization & Performance Tuning
Faster load times, cleaner data models, and clearer structure for the Power BI reports you already run.
Performance Intelligence · Monthly Deep-Dive
A recurring analytics layer on top of your dashboards, driver analysis and a stakeholder-ready narrative, every month.
Managed Analytics as a Service
Outsourced Power BI support for evolving needs, hybrid requests, KPI refinement, and ongoing advisory on retainer.
Why ServiceKPI Analytics
Business-first analytics, accountable to your decisions, not just charts.
Clarity over volume
Fewer, sharper KPIs with logic everyone understands, so reviews end in decisions.
Speed of delivery
We communicate clearly and move quickly, with tight scopes and fast turnaround.
Stakeholder trust
Numbers your leaders believe, backed by clean data models and transparent definitions.
Works with your stack
We plug into your existing Power BI and Excel ecosystem, no rip-and-replace required.
How the work helps
What a better reporting setup should improve
Good reporting should reduce friction, improve visibility, and make routine performance review easier to manage.
Less manual reporting
Reduce repetitive spreadsheet effort and recurring reporting handoffs.
Clearer KPI review
See performance in one place with cleaner logic and more useful structure.
Faster decision support
Make it easier to spot issues earlier and respond with better context.
Reporting that scales
Start with one use case and expand only where more support adds value.
Examples of common improvement areas. Exact outcomes depend on scope, systems, and data readiness.
Why this work is different
Built for teams that need clarity before more slides
Clear positioning, practical reporting, and structured delivery matter more than presentation-heavy dashboards that look polished but change very little.
Reduce repetitive spreadsheet work with KPI automation, recurring refresh workflows, and reporting built to save time month after month.
Go deeper than headline metrics with data models and analysis that explain what is driving performance.
Support prioritization, escalation, and performance decisions with reporting designed for operations, customer care, and leadership teams.
Experience behind the work
Someone who's been on both sides of the report
Most BI consultants have only built dashboards. I have spent more than 20 years on the operational side of reporting too, across customer service, operations, and finance, before moving deeper into business intelligence and analytics.
That means I do not just build Power BI dashboards. I focus on the numbers that actually shape decisions, because I have worked in the environments where those decisions happen.
Over the past four years, I have built KPI models, DAX measures, and automated reporting inside contact center and operations teams. I bring that same rigor into every project, with reporting built to be clear, useful, and decision-ready.
FAQ
Frequently asked questions
A few quick answers before you reach out.
Ready when you are
Let's make your KPIs make sense
Tell us your reporting challenge and we’ll respond with a clear path forward: no obligation, no jargon.